
Your ad platform dashboards show strong ROAS numbers. Campaigns deliver 4x or 5x returns. Reports look healthy and your team feels confident scaling budgets. Yet at the end of the month, the actual profit and loss statement tells a different story. Cash flow feels tight, margins are shrinking, and overall business profitability is declining. This disconnect between reported ROAS and real profitability has become common in 2026 as ad costs rise and competition intensifies.
ROAS measures revenue generated per dollar spent on ads. It ignores many real costs that eat into profit. When teams optimize solely for this metric, they often chase volume at the expense of sustainable margins. The result is campaigns that look successful on paper but quietly drain the business.
The Dangerous ROAS Illusion
Many marketers treat ROAS as the ultimate success metric because platforms like Meta and Google promote it heavily. A 400% ROAS feels impressive until you subtract product costs, shipping, returns, payment processing fees, and customer support expenses. What looks like strong performance can actually deliver razor-thin or negative profit.
For example, an ecommerce brand might celebrate 5x ROAS on a campaign driving $50,000 in sales from $10,000 spend. But if cost of goods is 45%, shipping and returns add another 15%, and other overhead consumes 20%, the actual profit margin might be under 10% or even a loss after ad spend. Scaling this campaign makes the problem worse, not better.
This illusion grows stronger with lookalike audiences and broad targeting. Platforms reward volume and lower-funnel efficiency, but the traffic attracted often includes price-sensitive or low-quality buyers who return products or never buy again.
Hidden Costs That Destroy Profitability
Several factors create the gap between ROAS and true profit.
Customer Acquisition Quality Varies. High ROAS often comes from broad campaigns that bring in one-time buyers or deal hunters. These customers have lower lifetime value and higher refund rates. The initial sale looks profitable on ROAS reports, but repeat purchase rates stay low and acquisition costs compound over time.
Rising Operational Expenses. Ad platforms show clean revenue numbers, but businesses face increasing costs elsewhere. Supply chain issues, higher fulfillment fees, inflation on product costs, and expensive customer service for complex returns all reduce margins. Many teams forget to update their ROAS targets as these costs rise.
Attribution Problems. Multi-touch attribution gaps mean credit gets assigned incorrectly. Last-click ROAS looks great while earlier touchpoints that actually influenced the sale get ignored. This leads to over-investment in bottom-funnel tactics that ignore brand building and customer retention.
High Churn and Low Retention. A campaign might drive strong first-purchase ROAS but attract customers who churn quickly in subscription models or never return in one-time purchase businesses. Without factoring lifetime value, short-term ROAS masks long-term losses.
Creative Fatigue and Quality Decline. To maintain ROAS, teams often refresh creatives rapidly or test aggressive offers. This can damage brand perception, increase refunds, or attract low-intent traffic that harms overall margins.
The Real-World Impact on Business Health
Companies chasing vanity ROAS numbers often experience several warning signs. Cash reserves dwindle despite "profitable" campaigns. Marketing budgets consume larger portions of revenue without proportional profit growth. Teams burn out optimizing for platform metrics while the business struggles.
In competitive markets, this creates a dangerous cycle. As profitability falls, pressure mounts to cut costs or increase ad spend further, leading to even lower quality traffic and worse unit economics. Some brands reach a point where they cannot grow without losing money on every new customer.
Better Metrics to Track Real Profitability
Shift focus from pure ROAS to metrics that reflect actual business health.
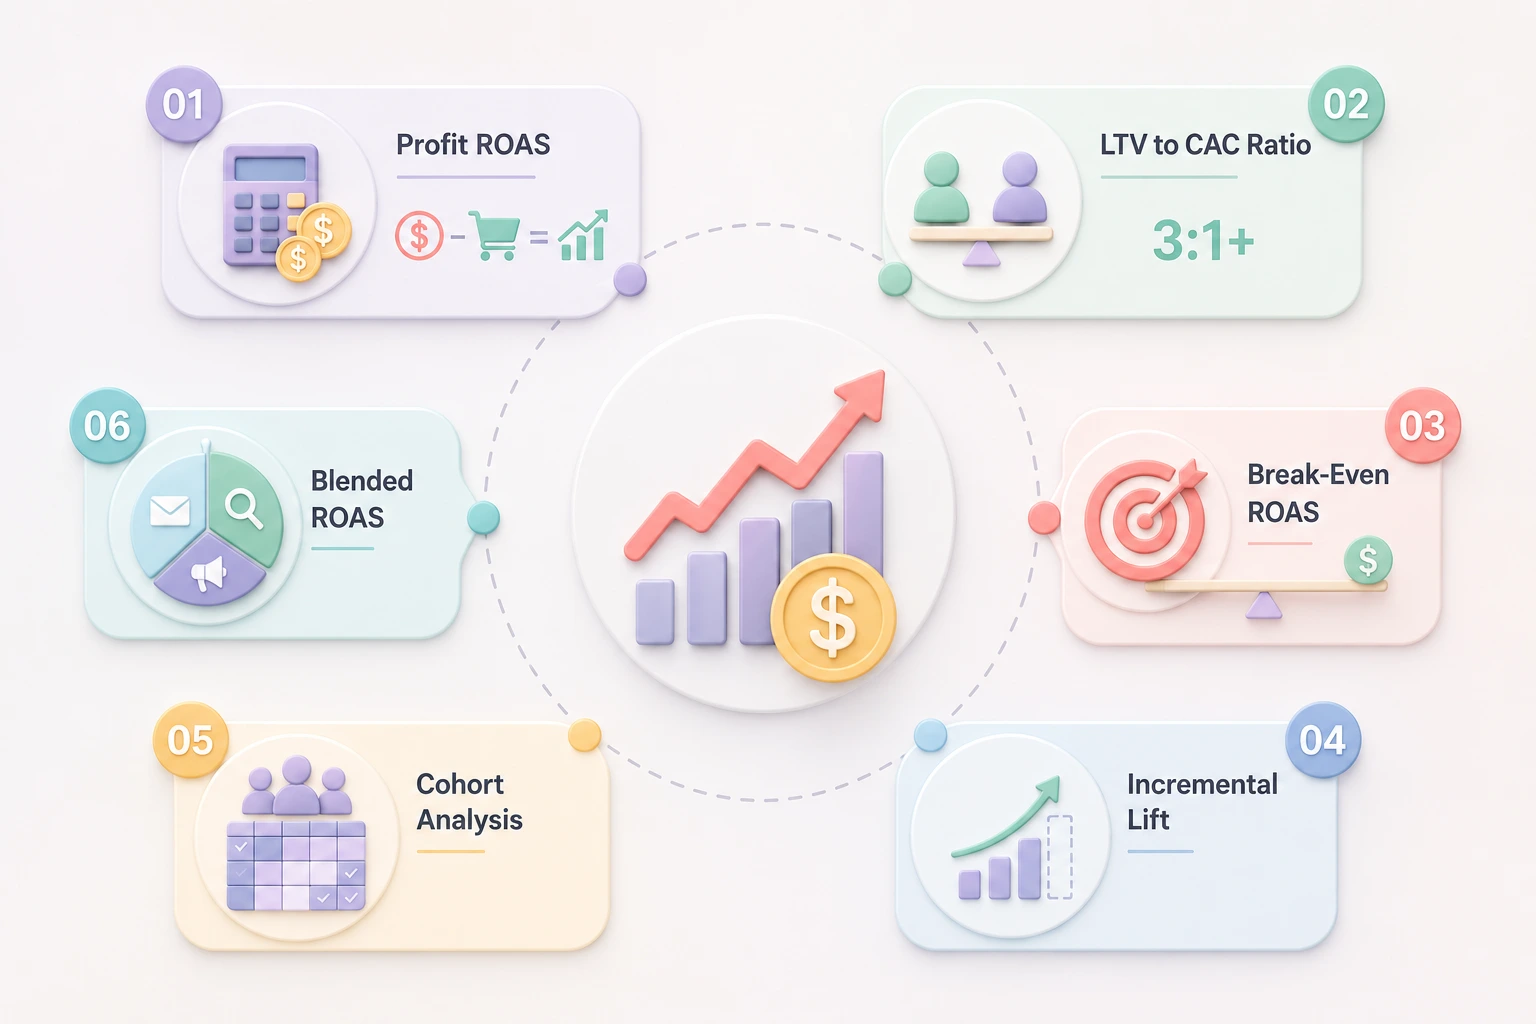
Profit ROAS or Contribution Margin ROAS. Calculate return after subtracting all variable costs, not just ad spend. This gives a clearer picture of whether each campaign truly contributes to overhead and profit.
Customer Lifetime Value to CAC Ratio. Track how much a customer is worth over time compared to what it costs to acquire them. A strong LTV:CAC ratio (ideally 3:1 or higher) ensures sustainable growth even when initial ROAS fluctuates.
Break-Even ROAS. Determine the minimum ROAS needed to cover all costs and hit target profit margins. Update this number regularly as expenses change.
Incremental Lift and True Incrementality. Use holdout tests or geo-lift studies to measure the real impact of ad spend rather than platform-reported numbers that include organic or cannibalized sales.
Cohort Analysis. Analyze performance by acquisition source and time period. This reveals which campaigns deliver profitable long-term customers versus those that only create short-term revenue spikes.
Blended ROAS Across Channels. Look at total marketing efficiency rather than isolated platform performance. Email, organic, and retention efforts often amplify or offset paid results.
Practical Steps to Align ROAS with Profitability
Start by building a full-funnel profitability model. Include all direct and indirect costs in your calculations. Work with finance to agree on accurate numbers rather than relying on platform dashboards alone.
Audit your traffic quality. Segment campaigns by audience type, offer, and creative. Identify which sources drive high-margin customers versus low-margin ones. Shift budget toward proven profitable segments even if their raw ROAS appears lower.
Improve post-click experience to reduce refunds and increase conversions. Faster load times, clearer messaging, simplified checkout, and strong trust signals turn more clicks into profitable sales.
Strengthen retention efforts. Invest in email flows, loyalty programs, and customer experience that boost lifetime value. Higher LTV gives you more room to maintain healthy ROAS while protecting margins.
Test and iterate with profit in mind. Run experiments that measure full profitability impact rather than just platform metrics. Be willing to pause or reduce campaigns that look good on ROAS but hurt overall numbers.
Review offers and pricing regularly. Aggressive discounts that boost short-term ROAS can destroy margins. Focus on value-based offers that attract the right customers at sustainable prices.
Building a Profit-First Advertising Strategy
The healthiest businesses treat advertising as one part of a larger system. They set ROAS targets based on actual business goals and update them as conditions change. They balance acquisition with retention and brand building instead of chasing platform efficiency alone.
In 2026, with rising ad costs and smarter algorithms, this disciplined approach becomes essential. Brands that optimize for profitability rather than vanity metrics build more resilient growth. They avoid the boom-and-bust cycles that plague ROAS-chasers.
Leadership plays a key role. Marketing and finance teams must align on definitions and reporting. Regular profitability reviews should carry as much weight as weekly campaign reports.
Moving Forward With Clear Eyes
Strong ROAS numbers can create dangerous confidence. Take time to dig beneath the surface and examine true profitability. The gap between platform metrics and business reality often reveals opportunities for quick wins through better segmentation, improved user experience, and smarter offer strategy.
Stop optimizing in isolation. Build systems that connect ad performance directly to profit and loss outcomes. When you align campaigns with actual business health, you gain the confidence to scale sustainably without nasty surprises at month end.
The advertisers winning consistently in 2026 focus on profitable growth, not impressive dashboards. They understand that ROAS is a useful signal, not the final score. By accounting for all costs and prioritizing long-term value, you can achieve strong returns that actually show up in the bank account.

